Upcoming Maintenance
Scheduled system maintenance will be at 12/28/2022 19:50 PST. The system will be unavailable for a few minutes at this time.
Journaling and micro journaling are both practices of recording one's thoughts and experiences, but they differ in the type and length of entries. Journaling entries can be quite long and detailed, and may be written regularly over an extended period. Journaling often covers a wide range of topics and can include personal stories, goals and plans. Micro journaling, on the other hand, is a more focused and concise form of journaling. Instead of writing in-depth reflections, micro journaling entries are short and typically only cover one specific topic or event. In fact, they can even just be simple facts or "data points" that you might record on a wall calendar, if computers didn't exist!
The main difference between these two types of journaling is their format, the length and the amount of detail in each entry. Journaling often allows for more introspection, self-discovery and could be seen as a personal project, while micro journaling could be perceived as more of a daily habit or a to-do list, focused on specific goals and tracking certain aspects of life. Micro journaling can often be done in as little as a minute or two per day.
Both Journaling and Micro journaling can be beneficial, depending on what you want to achieve. If you want to gain insight into your thoughts, emotions, and patterns of behavior, traditional journaling may be a better choice. If you're looking for a way to track specific goals or events, improve your memory and cognitive function or build a succinct "time capsule" of facts about your life, micro journaling may be a more appropriate choice.
Micro journaling is ripe for data mining and reporting where a platform like WizerFood can serve as both the data repository and an AI engine to help make sense of the data. WizerFood as a central repository for date-driven data means you've got one less app to worry about (one as a calendar, one as a recipe rolodex, one as a journaling tool, etc.). There are two primary ways to use WizerFood for micro journaling:
Notes. Free-form notes can be used for traditional journaling, although the length limit is 500 characters, so this is most suited for shorter entries. You can add them using the "Note" item type:
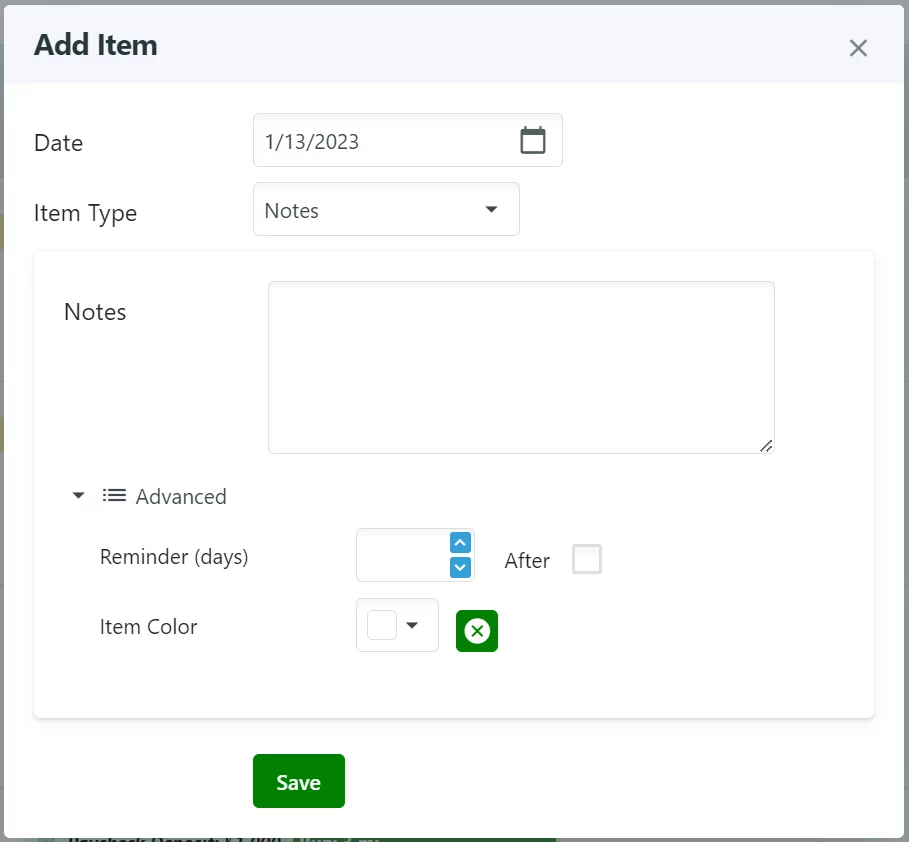
One can set reminders for notes - either to remind ahead of a future-dated note or remind after a certain amount of time passes after a note. This can help you remember to record or revisit certain events or facts.
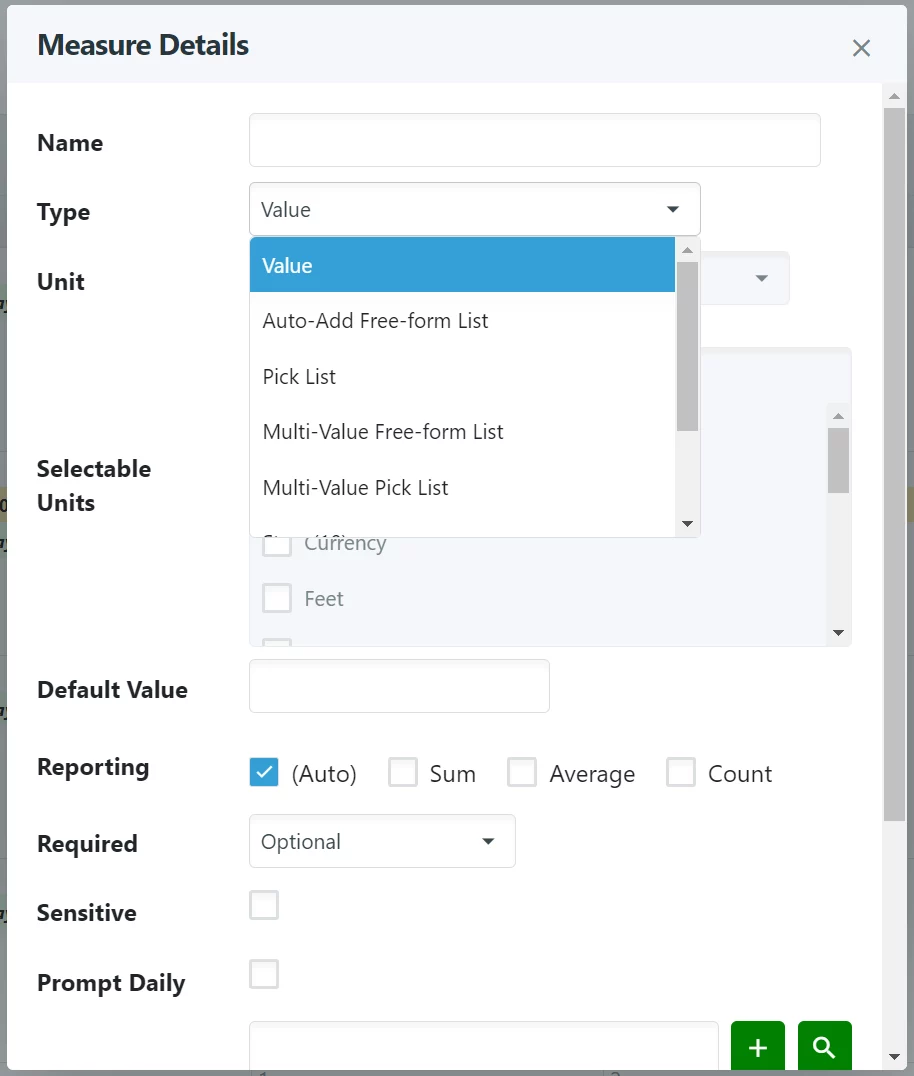
Measures. Recently a new feature was introduced which allows measures to have their own subtype. This subtype can be set here, on the measure details popup:
What can you do with measures? You can track almost anything related to dates that you might have been tempted to instead use a spreadsheet for. With that in mind: fitness activities are also a specific type of measure, since you can measure the duration, distance, calories burned, etc. of a fitness activity, and it occurs on a date. Measures (and really all types of WizerFood calendar event) can reflect both "happened" and "planned" - where I consider the sweet spot being "planned items become happened items" (that I might tweak to match reality).
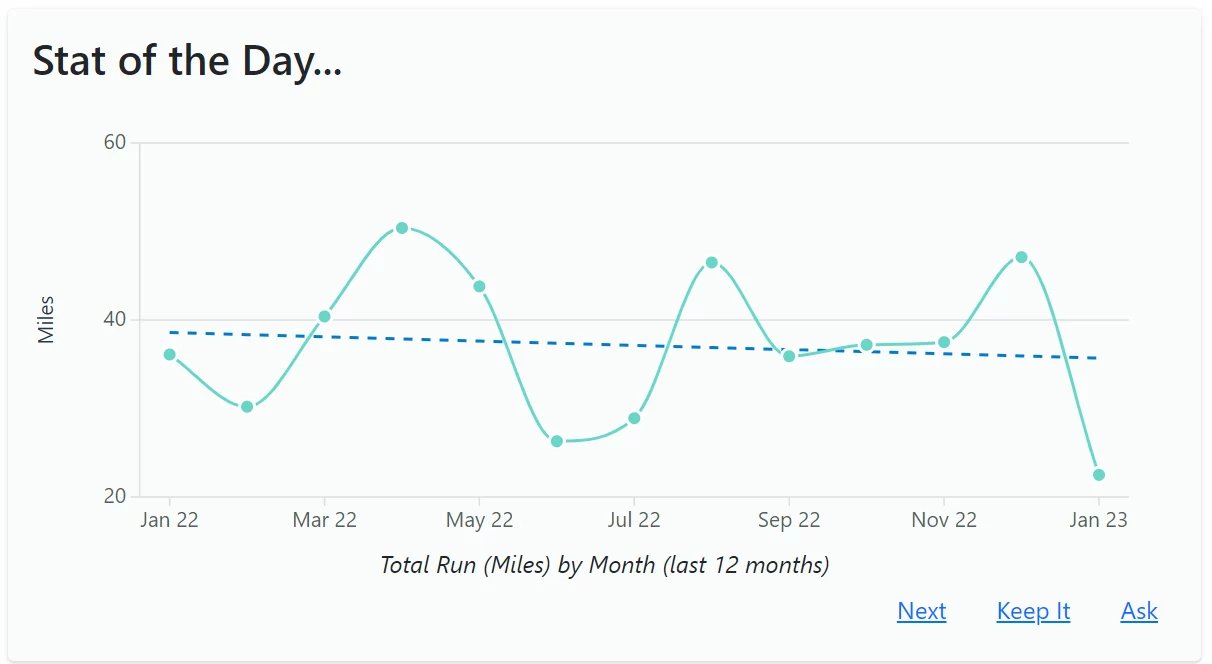
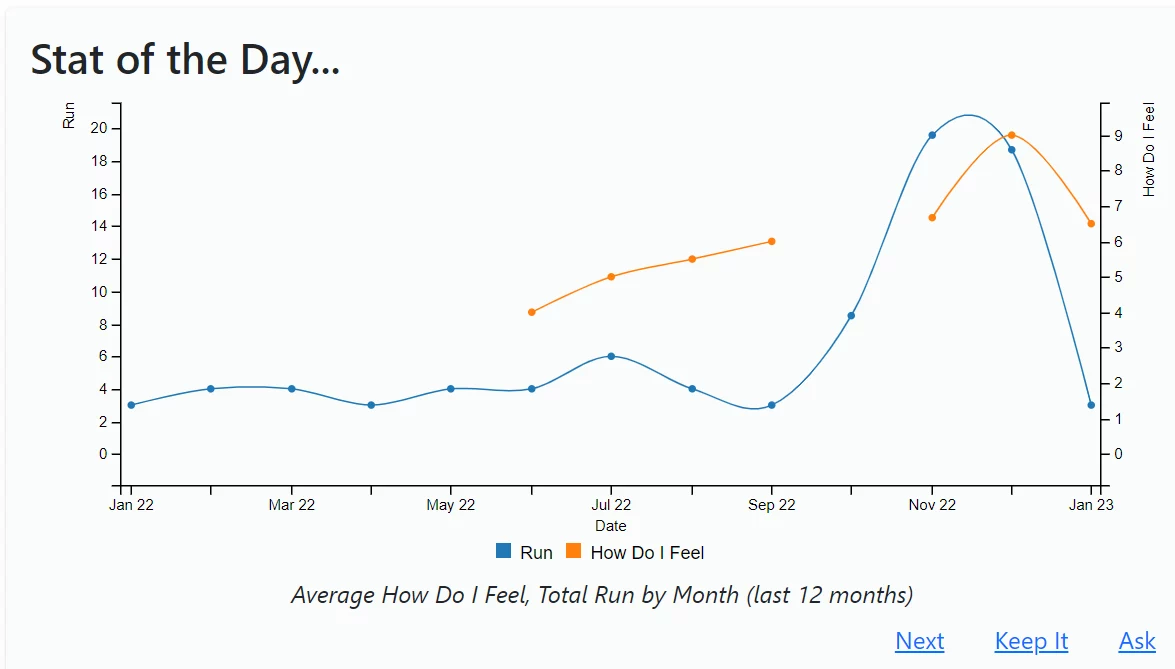
I run, so I like to keep track of how far I go and in putting it on the calendar, I can identify how often I do it, length of time between runs, etc. That's all metrics that WizerFood can figure out for me, using "Stat of the Day" on the Dashboard page. For example, without doing anything beyond recording my runs, I can see it visualized this way:
Going beyond obvious numbers like distance, what if I recorded how I felt on a scale of 1 to 10 on any given date? Beyond my already intuitively knowing that running makes me feel good on some level - what does the correlation look like? I could create my own custom measure to do this, and set the entry style to "Stars":
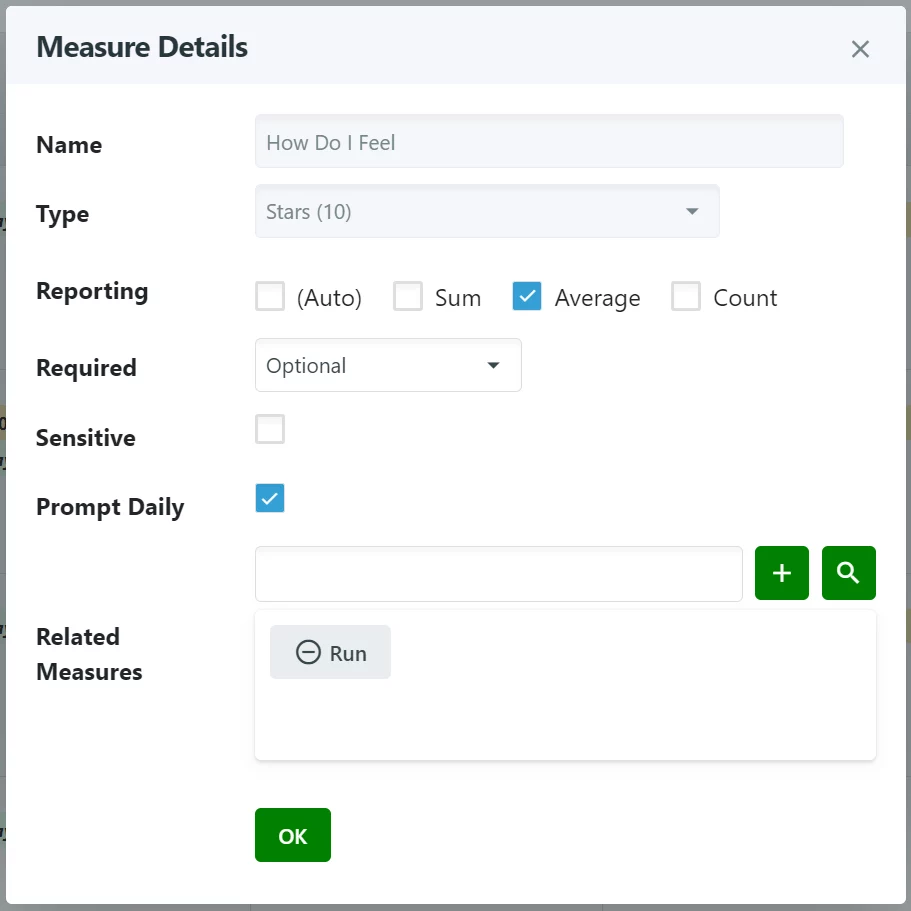
Of note, I've identified that I'm interested in getting an average of this measure, where a sum doesn't really have any usefulness.
With this available, if I were to add measure entries for "How I Felt" over a range of dates, WizerFood can come up with a visualization that includes both my run distances and my "how I felt" scores:
This is just one possibility that comes from capturing facts into your calendar, and WizerFood makes this fast, easy, and interesting.
Let's consider another example, aside from fitness. Let's look at a micro journaling example that's illustrated in this Medium article. Lets say you wanted to capture a "word of the day" - something that when captured over many weeks, could show patterns. Further, you might want the flexibility to add new words as they come to mind - but you also might want to reuse some words: not only to cut down on typing but to detect repeating thoughts and feelings.
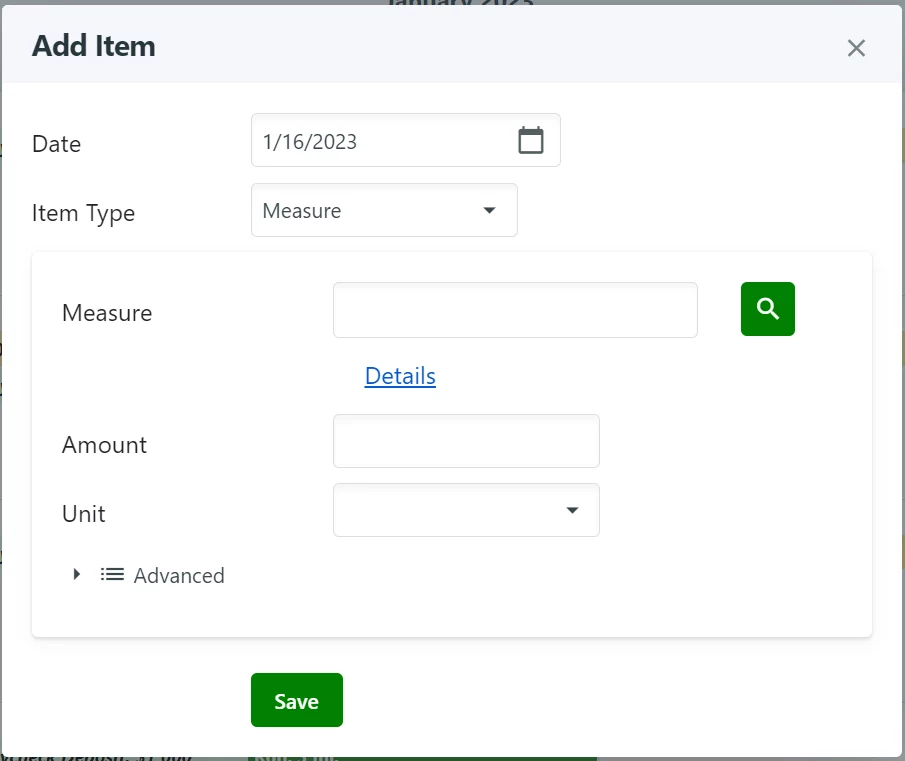
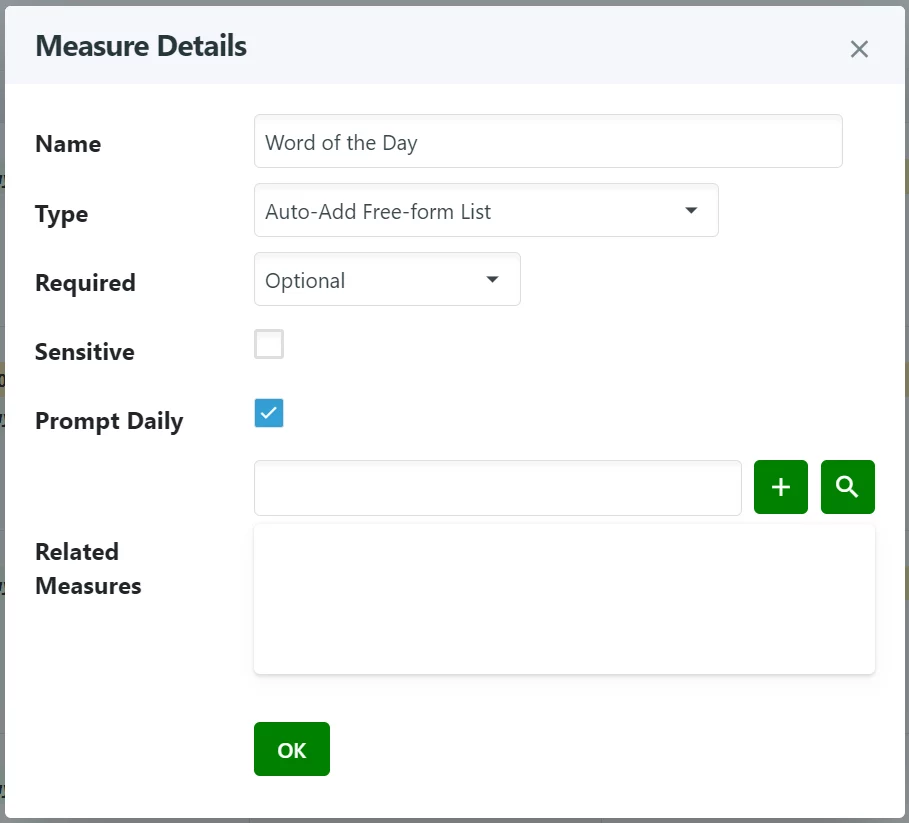
To achieve this, we could create a new measure called "Word of the Day" and set its entry type to "Auto-Add Free-form List." We could do this starting by clicking on a date in the calendar, changing the entry type to "Measure" and then clicking on the Details link. (I'll provide a video towards the end of this article that shows the steps of how this is done.)
Next, we provide the measure name and the entry type:
Clicking on "Ok", we're returned to the "Add Item" popup where we can provide our first word of the day value:
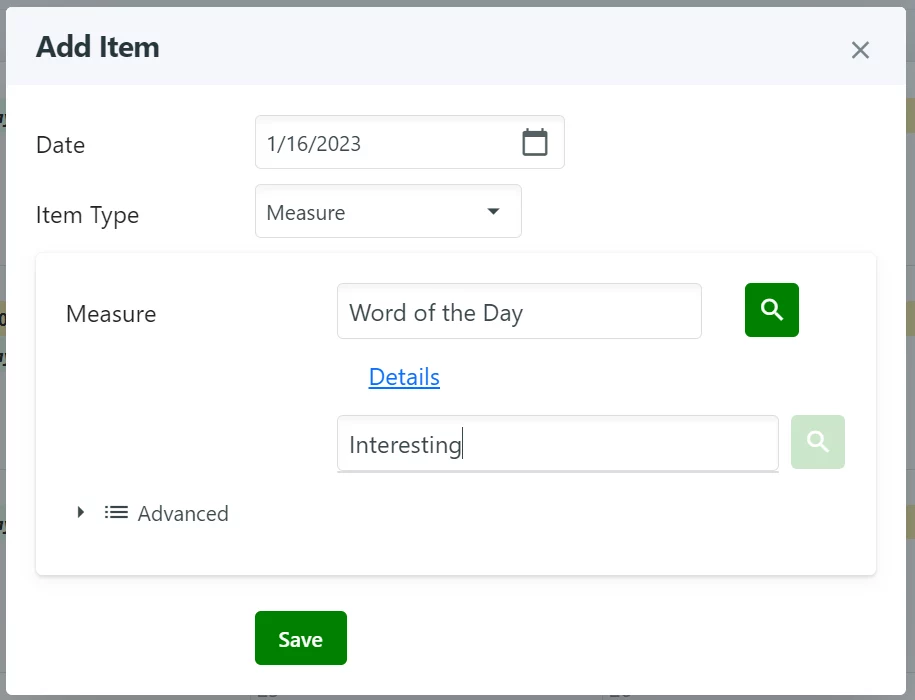
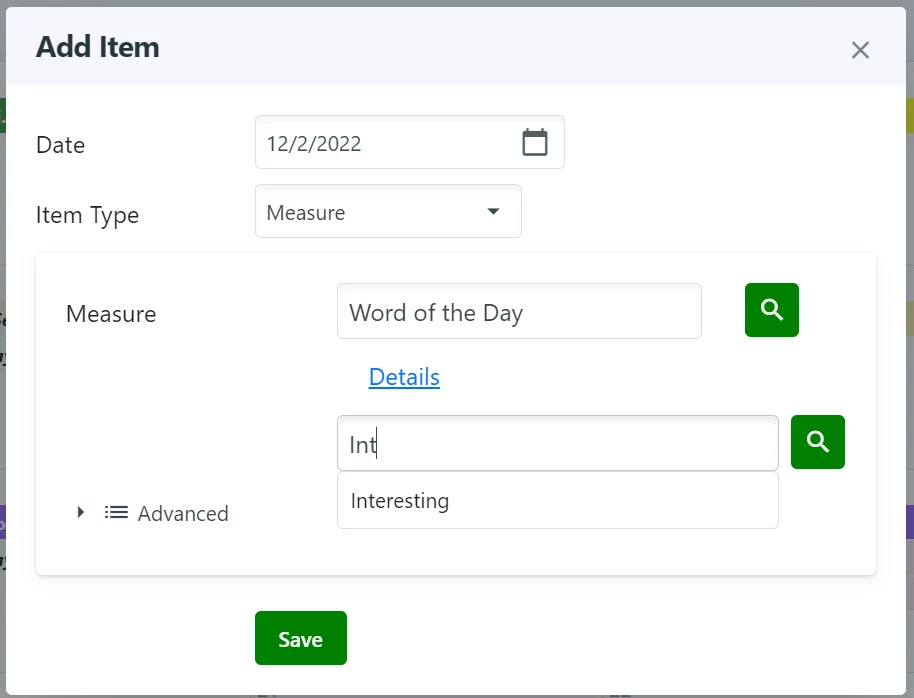
Next time we want to add another word of the day to a different date, we can click on the date of interest to add a new item, pick "Measure" as the type, provide "Word of the Day" as the measure (you can type it or pick it using the lookup button), and then provide the word "value." If we start typing a word, words we previously used can be suggested, we can use the lookup button to select from previously used words or we can type a brand-new word (which becomes available for future lookup):
Now what? Let's say we've entered many "words of the day" over a period. We can get a visualization of this data in the "Stat of the Day" section of the Dashboard:
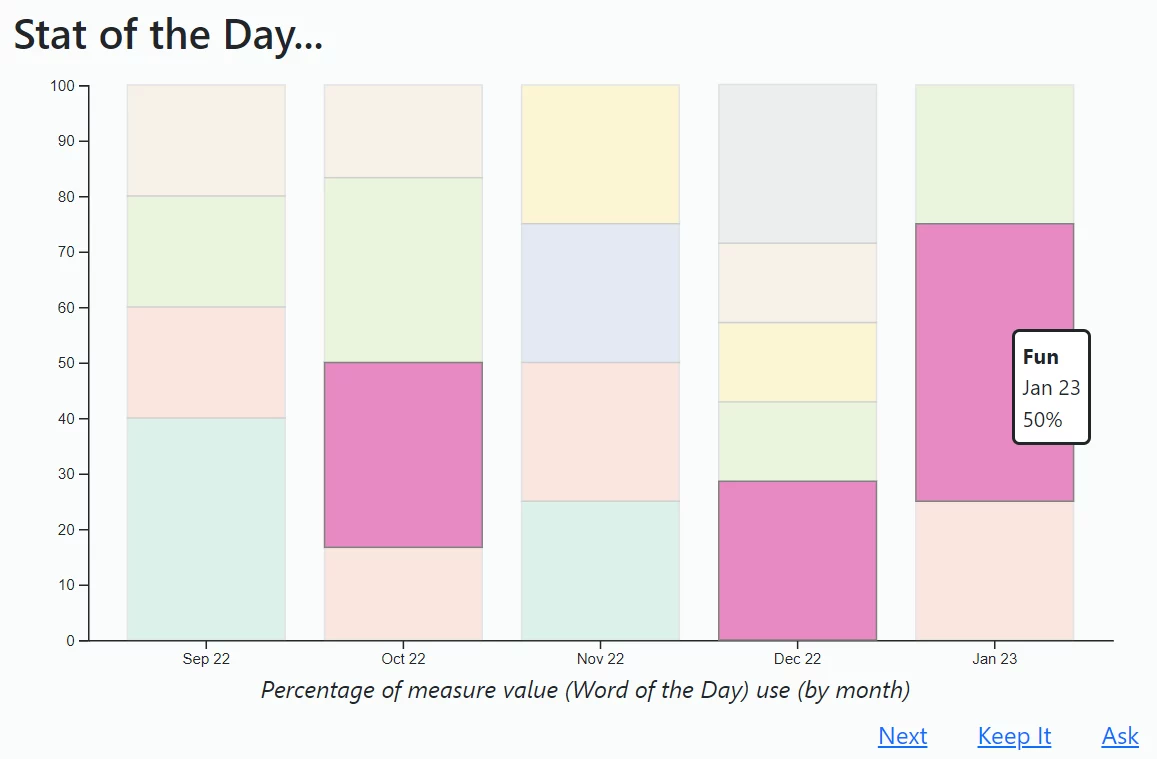
What's this visualization telling us? It's showing for the dates we did include a "word of the day," what percentage of the time different words were used, grouped by month. This turns it into effectively a "percentage stacked bar chart." You can hover your mouse over each rectangle to see the word, highlighted over all months. I hope positive words are filling up your chart!
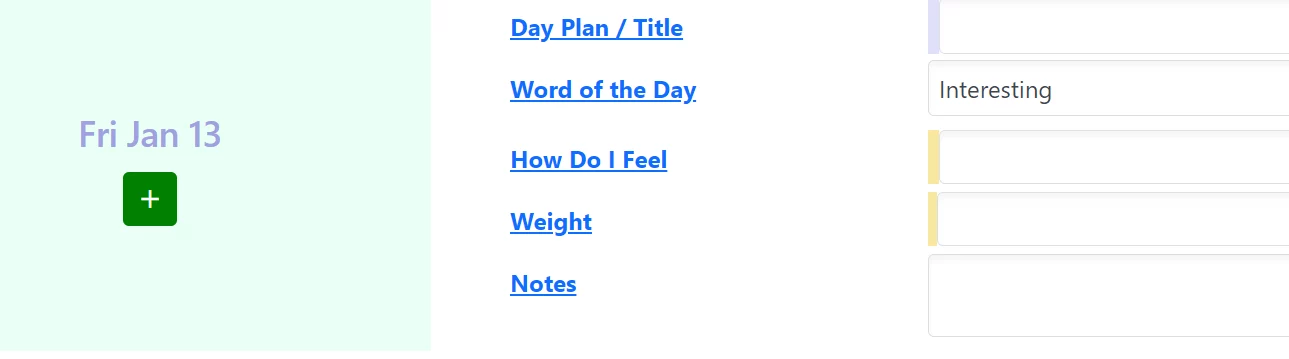
Let's look at a setting which was illustrated above (on Measure Details), namely checking the "Prompt Daily" checkbox. This will cause the measure to appear for every date, on the Day Planner view. What this means is, for example, if we enabled Prompt Daily for our "Word of the Day" measure, it will appear on every day and either be blank (implying a need to provide it) or present its value for the date listed:
(Further: marking it as "Required," will cause the measure to be highlighted with a warning icon if it is not provided for a recent date.)
Another thing you can do is hide data you consider to be too sensitive to show on things like Stat of the Day reports. For example, if you think you'd show your dashboard to other people and you don't want to reveal your weight tracked as a measure, you can check the checkbox for "Sensitive" on the Measure Details popup. If you use the "keep it" option for a report that shows a measure that's not marked as sensitive and then later change it to being sensitive, it will continue to be shown on the "kept" report panel (but not on Stat of the Day).
Returning to concepts I started covering in "How WizerFood Can Help With Finances", I'm going to start tracking my "food spending" in 2023 using a dedicated measure. This aligns with something I discussed in a different article, "Using Mint.com and Power BI to Visualize Your Personal Finances", where I built reporting that showed spending, by category. This approach used data from Mint.com, but this is not a silver bullet. My tracking food spend right in WizerFood is not overly hard to do and can be more flexible. For example, if I use cash for a meal, I can track it where that wouldn't be automatic with a financial data feed (from mint.com or my bank). In other words, some level of manual effort / thought is going to be needed anyhow, so having a simple field available on my Day Planner to enter what I know I spent yesterday related to food is not a big deal to me.
Ultimately the reporting I had done using mint.com and Power BI told me that food was my biggest expense category that I could easily influence. (Things like a mortgage payment: sure, that can be influenced through refinancing, say, but it's not something that I can easily change on a day-to-day basis.) What I'm hoping to find is that as reporting starts to fill in on a monthly level, I can see my total food spend and create actions based on what I see - and I can share it with my family in a simple, visual way.
Another thing that I want to draw attention to is on the Stat of the Day panel, namely the "Ask" link. Clicking that brings up this popup:
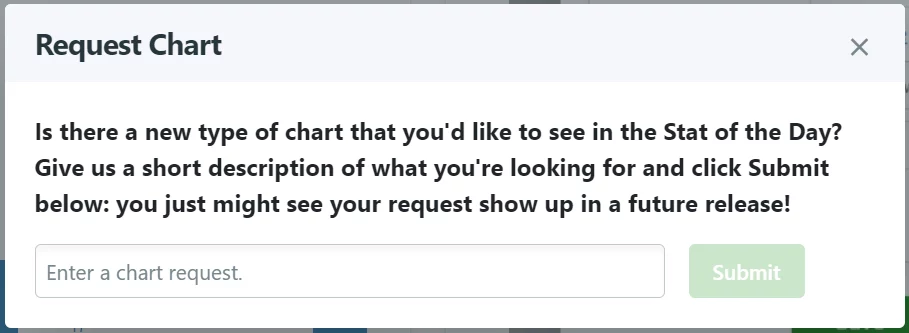
The idea here is you can propose any new kind of visualization and although there's no gaurantee it'll get added - there's a good chance it will! In fact, until July 31 2023, if you make a suggestion that does get included in the product, I'll give you a free Premium edition license for five years!
I can't outline every possible use case here, but I hope this gives some ideas of how you can use WizerFood to capture facts and visualize them in a way that's meaningful to you. I'll continue to talk about new visualizations and features through blog articles and stay abreast of changes using release notes. Definitely stay tuned for more "entry types" for measures, too: the sky is the limit for what's possible, and I'm looking forward to your good ideas.
I've summarized several concepts in this article, in the video below. This should help illustrate how to get to the various screen shots that I've presented above.